A simple moving average smooths out the spikes of your data. But it has one weakness: it reacts late. When the trend changes, the curve takes several days to show it.
Why? Because every day in the window counts the same. In a 3-day average, the temperature of 3 days ago weighs as much as today’s. Yet today’s value tells you what is happening now.
Weighted and exponential moving averages fix this: they put more weight on the most recent days. We use the same example: the temperatures in New York at the start of January 2020.
Why 3 days? And which period should you choose?
In this article, we use a 3-day period. 3 days isn’t special: we chose it because it is short enough to check by hand, and because the effect is already visible in two weeks of data.
In real life, the period depends on the rhythm of your data:
- 7 days for daily sales or website visits: it removes the difference between weekdays and weekends;
- 3 or 12 months for monthly figures: 12 months removes the seasons;
- 20, 50 and 200 days for stock prices: these are the standard periods used by traders (20 days is about one month of trading).
The rule is always the same: the longer the period, the smoother the curve, but the later it reacts. To change the period, adjust the range size in the formula and the weights (or alpha) accordingly. For a 10-day EMA, alpha = 2 / (10 + 1) = 0.18.
Weighted moving average (WMA)
The idea: weight each day. Here, we assign weights of 1 to the oldest day, 2 to the day before, and 3 to the most recent day. Today counts 3 times as much as the first day of the window.
Let’s calculate it by hand for January 3 (temperatures 2, 5, and 7):
- simple average: (2 + 5 + 7) / 3 = 4.7
- weighted average: (2×1 + 5×2 + 7×3) / (1 + 2 + 3) = 33 / 6 = 5.5
The weighted result is closer to 7, the latest temperature. In Excel, write the weights in G2:G4, then in D4:
=SUMPRODUCT(B2:B4,$G$2:$G$4)/SUM($G$2:$G$4)
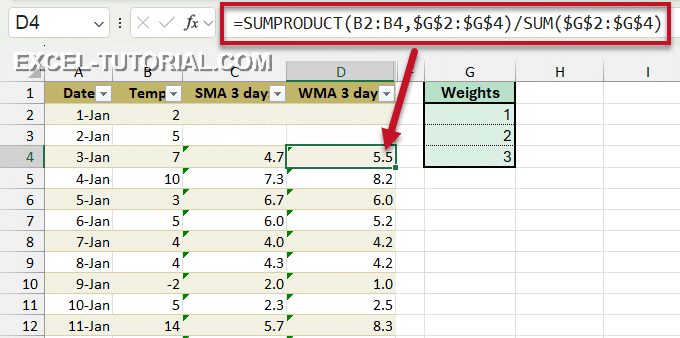
SUMPRODUCT multiplies each temperature by its weight, then adds the results: that is the 33 of our calculation. Dividing by the sum of the weights (6) brings it back to an average.
Copy the formula down. This time, lock the weights with $: they must stay in G2:G4 while the range B2:B4 slides down.
What the gap between WMA and SMA tells you
Now compare column D (SUMPRODUCT) with column C (AVERAGE). The two values are never far apart, but the gap between them is not random:
- When the temperature rises, the WMA is above the SMA: 13.0 against 11.3 on January 12;
- when the temperature falls, the WMA is below: 10.8 against 12.0 on January 13;
- when the temperature is stable, the two are almost equal: 4.2 against 4.3 on January 8.
This is logical: the WMA gives the most weight to the latest day, so it moves first in the direction of the change. That gap is useful in itself. Subtract the two columns:
=D4-C4
A positive result means the trend is going up, and a negative one means it is going down.
Exponential moving average (EMA)
The exponential average works differently. It doesn’t use a window of days: each new result mixes today’s value with yesterday’s average.
The smoothing factor is alpha = 2 / (period + 1). For 3 days, alpha = 0.5: today’s temperature counts for half, and yesterday’s average for the other half.
For the first day, there is no previous average, so we take the temperature itself. In E2:
=B2
Then, in E3:
=$G$7*B3+(1-$G$7)*E2

For January 3: 0.5 × 7 + 0.5 × 3.5 = 5.25. Because each result contains the previous one, the EMA never completely forgets the past, but older days count less and less.
The difference on a chart
Look at January 11: the temperature jumps from 5 to 14 °C.
- the simple average only reaches 5.7: it hasn’t “seen” the change yet;
- the weighted and exponential averages reach 8.3 and 8.5: they follow the change at once.

Which one should you use?
| Average | Reacts | Use it to… |
|---|---|---|
| Simple (SMA) | late | see the general trend over a long period, without being fooled by one bad day |
| Weighted (WMA) | faster | follow recent changes, when the last values are the most reliable (recent sales, for example) |
| Exponential (EMA) | fastest | spot a change of trend as early as possible: it is the standard in finance and trading |
⚠️ Reacting faster has a cost: a fast average also reacts to one isolated spike and can give a false signal. That is why traders often compare a fast average with a slow one.


